

Why is buy rate so important?
Buy rate is a crucial metric reflecting product purchase rates compared to exposure (pageviews), providing invaluable insights into customer behaviour and preferences.
Any business can decide on Digital Asset Optimisation and Targeted Marketing Activations actions based on gut feeling, past sales data and outdated retailer information.
However, businesses that learn how to derive those actions through accurate, real-time insights have a significant advantage over their competitors.
In this guide, we will investigate what you can do with eRetail Audit Marketplace to make data-driven decisions to improve your buy rate and always be one step ahead of the competition.

Product Visibility and Pageviews
Buy rate and pageviews are often closely related. If your products have experienced a decline in buy rate, it might be because they received less visibility than usual.
Some common explanations that can cause this are:
All those reasons and more, are certainly driving forces that can cause fluctuations in your product's visibility. But what was the real driver of your decline (or uplift)? What really impacted your sales during that period?
Using eRetail Audit Marketplace, you can understand what was the driver of your decline (or uplift) and feel confident about your next action.
Sales Pulse (Image 2)
The first step would be to visit Sales Pulse and filter only one or more of your brands so that you can investigate your own product insights.
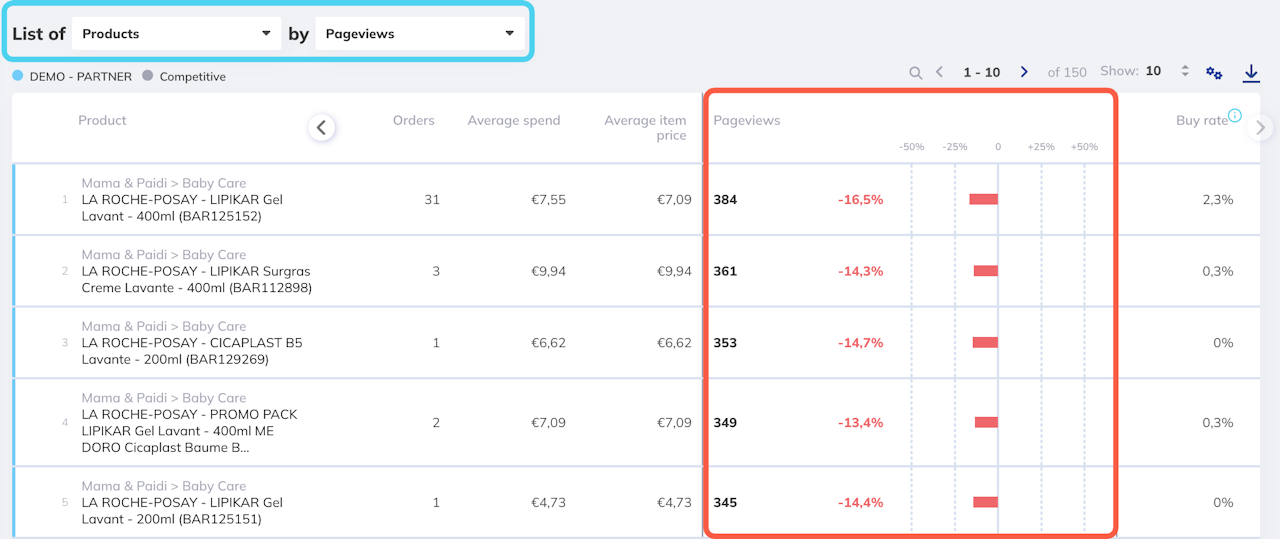
Next, scroll to the list section and ensure you sort your products by pageviews. This will give you your products in a list with the ones that have the highest pageviews first.
You can click and expand any column to view the decline or uplift % of any product compared to the previous period.
E.g. if you've selected to view data for one week (like in the example), then the compared period will be, by default, the week prior to your selected dates.
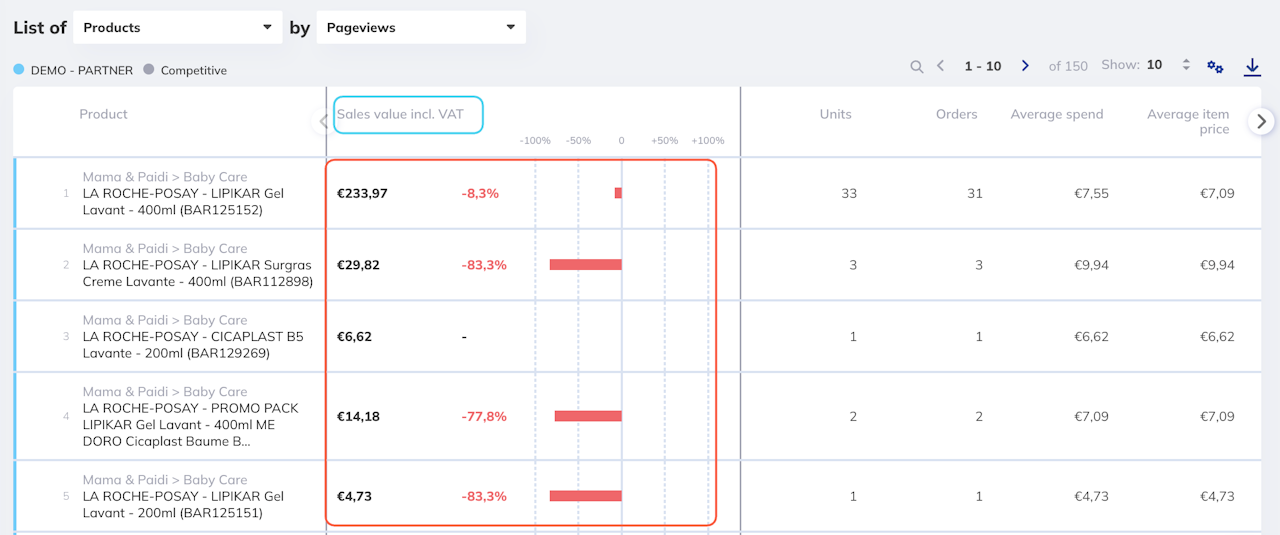
Now you can understand the exposure and visibility of each of your products and you can easily understand if a decline in pageviews had an impact on your sales value (Image 3).

Share of Assortment and Keyword Trends
Visibility and pageviews are certainly important to understand the drivers that affected your buy rate and where to focus in order to improve it.
However, getting the right Share of Assortment is also directly related to your products, brands or categories getting the visibility they deserve.
Direct Navigation and Share of Assortment (Image 2)
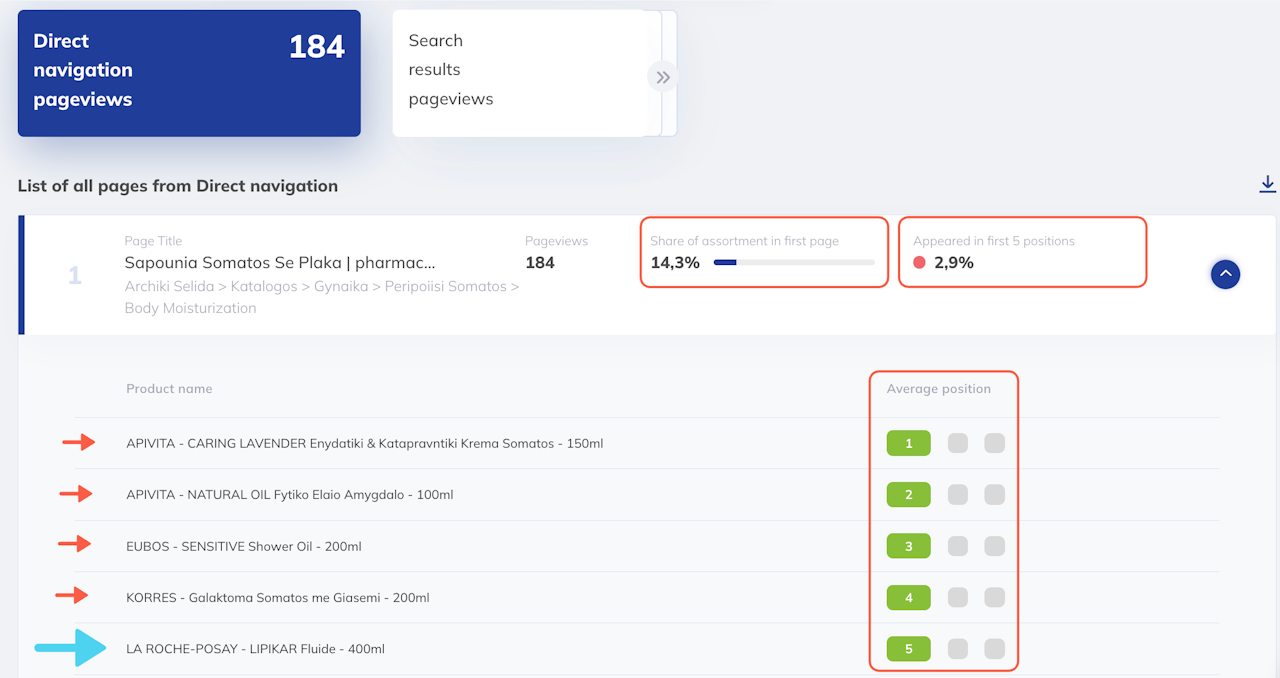
Browsing Experience can help you understand if you get the right Share of Assortment within your category.
Looking at your category, you can see the total pageviews the overall category has received as well as the ranking of your products (and competitors' products) within the category.
In the example, we can see that our product ranks 5th in the category on average, leaving a lot of room for our competitors to gain more visibility.
Your product ranking within the category has a significant effect on your sales value, orders and visibility, and it's directly affected by the quality of your content that helps users recognise your products and brands and increases loyalty.
Keyword Trends (Image 3)
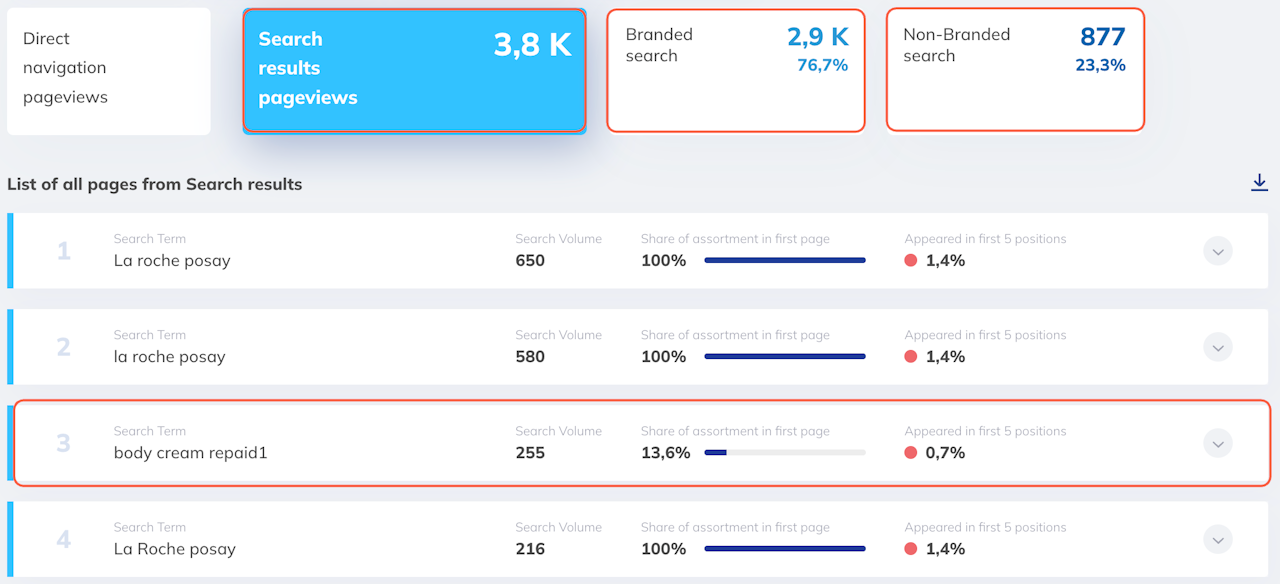
Now on how to further optimise your digital assets. Browsing Experience helps you understand which keywords mostly affected your visibility.
With overall, branded and non-branded keyword trends you can better understand how users find your products in the retailer but also, how well you rank in those keywords.
You can use Keyword Trends to better:
Optimise your content and add relevant keywords in your title, description, product images, and marketing materials to attract more users already searching for your brand and products.
Understand your ranking within keywords and see if your competitors leverage your brand name to rank higher in their search results.
Ensure that the right products rank first within your branded keywords. Your Hero products should be the spotlight in every search relevant to your brand.

Advanced Segmentation
Of course, using eRetail Audit Marketplace allows you to understand the drivers that affected your buy rate and also how to focus on data-driven decisions to improve your buy rate with your marketing efforts.
However, we make it easier for users to continuously monitor the effect of their actions and keep a close eye on products, brands, and categories of interest for any unwanted fluctuations over time.
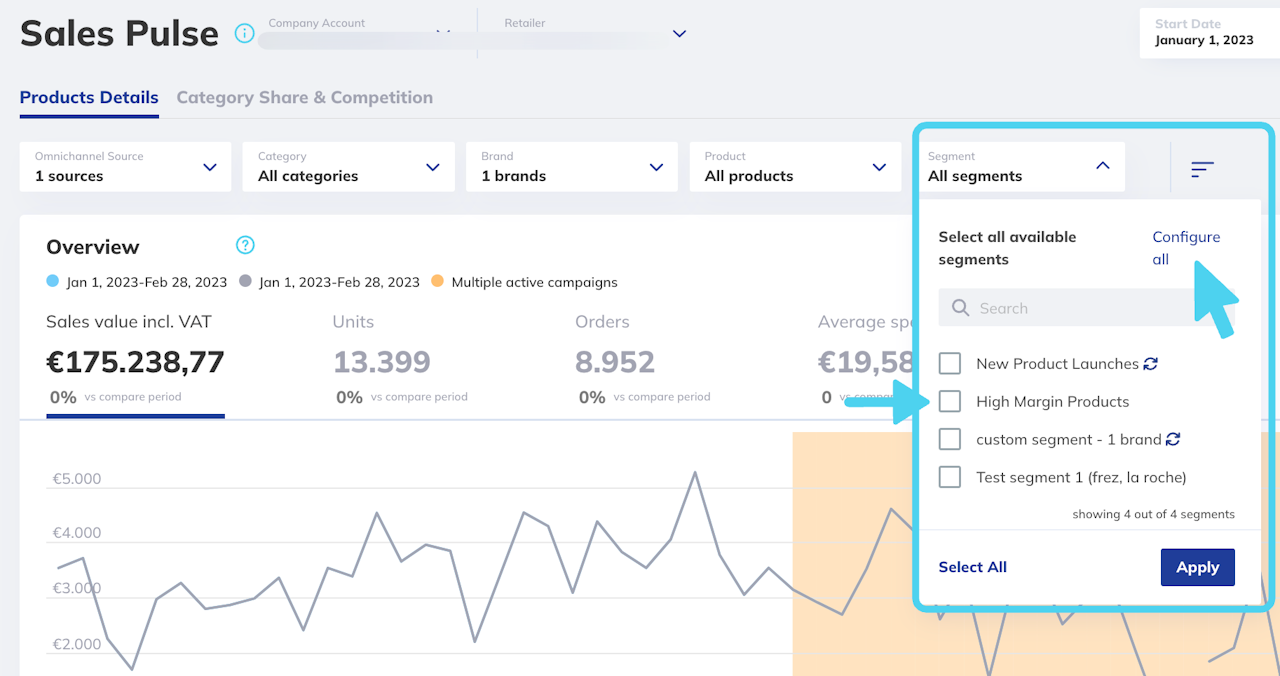
Advanced Segmentation Monitoring (Image 2)
You can create segments with products that:
Have a low pageview count
Hero products that have experienced a decline in buy rate
Top category products, including competition (if available)
Products that you focus your marketing activations on
Top categories you have a presence in
Those are just a few examples of more advanced segments you can easily create to quickly and effectively keep track of.
Segments can also include brands and categories so you can get more creative to align your business priorities with your marketing efforts.

