
Brands | Tips & Tricks!
Brands page is a core analytics pages where you can find Sell-out data, Growth rate% and Market Shares of the Top 10 Brands performance of any category level.
This is usually the next screen to look out for after navigating from "Categories page" where you start an in-depth analysis.
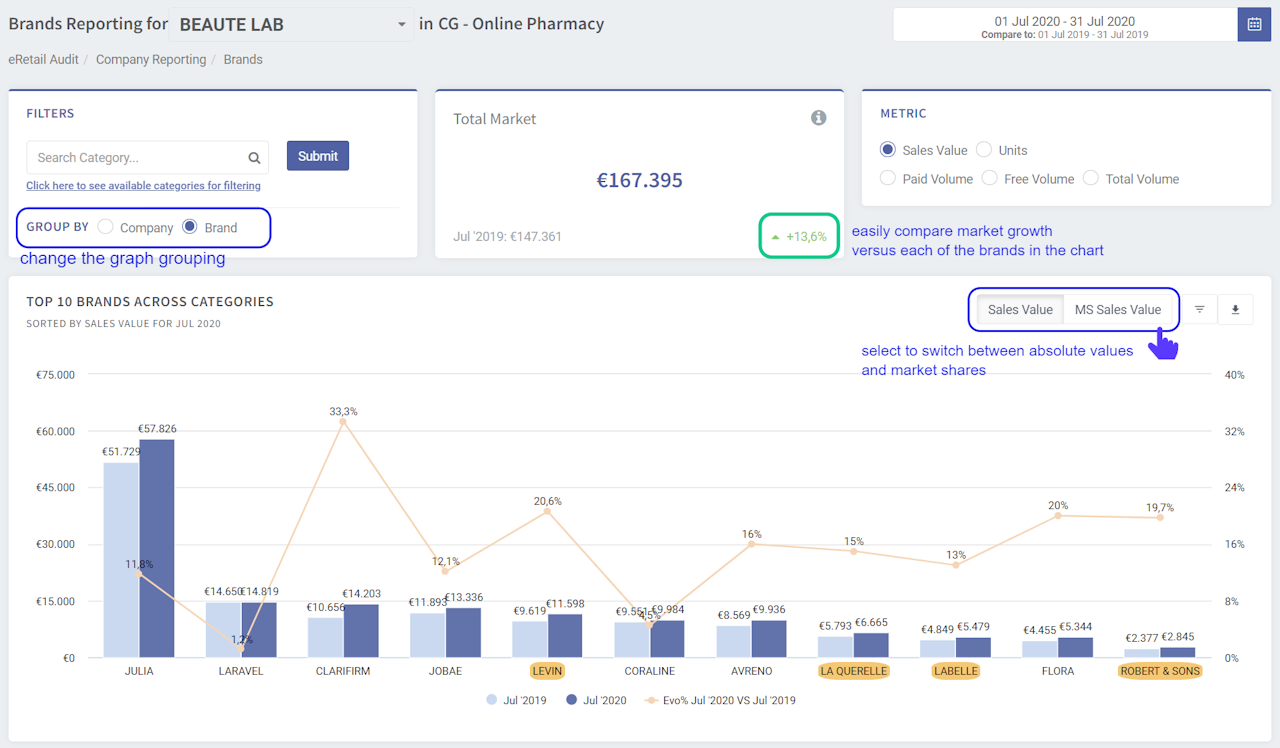
Sell-out data & Growth Rate% of your own brands but also the competitive ones
➡️ Do you want to see the same information but in terms of Units? Then click in the Units selection, in the METRIC section.
➡️ In case you prefer seeing the data in a Company instead of a Brand level you can select Company, in the section GROUP BY.
➡️ Compare each brand’s growth with the category’s growth in the box right above.
[image 1]
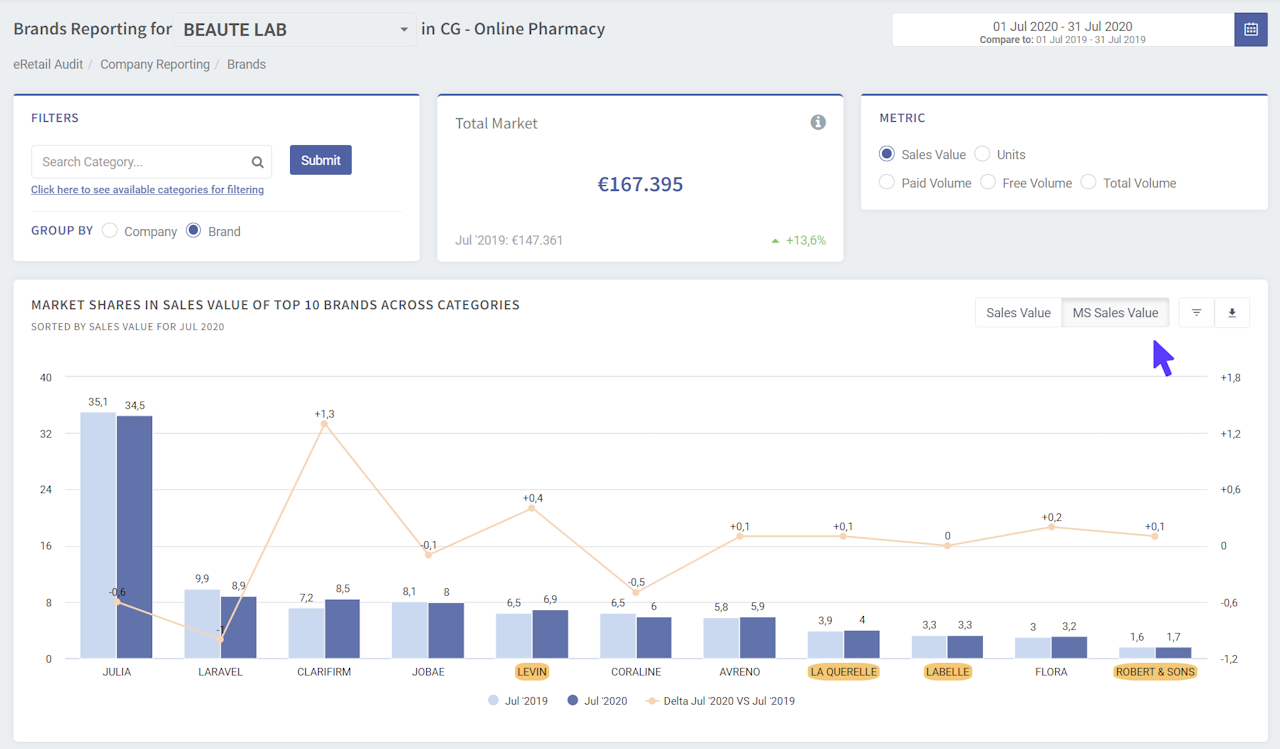
Market Shares of the Top 10 Brands just by clicking on MS Sales Value
on the chart to change from absolute values to market share data.
[image 2]
PRO TIP: Do you want to deep dive in SKU level for each brand? By clicking on any brand , you are automatically transferred in the screen of Exploration which includes all the raw data.

